German Translation
AI translation is pretty amazing these days. AI tooling is pretty great too. I host my websites on GitHub Pages and I have a ChatGPT subscription. ChatGPT co...
Ein potenzieller Kunde machte mich auf den Artikel Empowering the Energy Transition Through Fast and Flexible Network Simulation aufmerksam. Darin wird das Open-Source-Projekt Power Grid Model DS (pgm-ds) beschrieben. DS steht für Data Science.

pgm-ds erweitert das Power Grid Model. Laut Dokumentation ist das eine Bibliothek zur stationären Analyse elektrischer Verteilnetze. Das Modell enthält Komponenten für:
und mehr. Damit lassen sich Leistungsflüsse, Zustandsabschätzungen und Kurzschlüsse modellieren.
Power Grid Model DS baut darauf auf und bietet eine übersichtliche API zum Modellieren und Simulieren des Netzverhaltens. Es richtet sich an datenwissenschaftliche Anwendungen, darunter Netzwerkanalysen und Simulationen. Eine Grid-Datenklasse hält das gesamte Netz konsistent und ermöglicht die Erweiterung der Datenstruktur.
Die technischen Schritte waren einfach. Die Bedeutung der Ergebnisse zu verstehen, kostete mehr Mühe.
pgm-ds ist wirklich benutzerfreundlich. Aus der Jupyter-Notebook-Dokumentation ein Skript für die Demo zu machen, war keine große Sache. Zu begreifen, was ich betrachtete, war schwieriger.
Das Paket enthält eine Netzvisualisierung mit einem WSGI-Frontend auf Basis von Flask, die im Browser angezeigt werden kann. Die Grafiken verwendet Dash Cytoscape, eine elegante und leistungsfähige Visualisierung von Graphen.
So hübsch das Bild war, die wirklich aufschlussreichen Daten standen als Tabellen in der Konsole. Ein paar Beispiele:
| id | u_rated | node_type | feeder_branch_id | feeder_node_id | u | x_coor | y_coor |
|---|---|---|---|---|---|---|---|
| 1 | 10500.0 | 0 | 64 | 61 | 0.0 | 125.848.. | 245.522.. |
| 2 | 10500.0 | 0 | 65 | 61 | 0.0 | 385.322.. | 175.70.. |
| 61 | 10500.0 | 1 | -2147483648 | -2147483648 | 0.0 | 134.732.. | 145.515.. |
| id | from_node | to_node | from_status | to_status | feeder_branch_id | feeder_node_id | is_feeder | r1 | x1 | c1 | tan1 | i_n | i_from |
|---|---|---|---|---|---|---|---|---|---|---|---|---|---|
| 63 | 61 | 12 | 1 | 1 | 63 | 61 | True | 0.411.. | 0.023.. | 0.0 | 0.0 | 110.013.. | 0.0 |
| 74 | 20 | 8 | 1 | 1 | 63 | 61 | False | 0.585.. | 0.000.. | 0.0 | 0.0 | 227.694.. | 0.0 |
| 125 | 96 | 94 | 1 | 1 | 63 | 61 | False | 0.036.. | 0.04.. | 0.0 | 0.0 | 362.904.. | 0.0 |
| id | from_node | to_node | from_status | to_status | feeder_branch_id | feeder_node_id | is_feeder | u1 | u2 | sn | tap_size | uk | pk | i0 | p0 | winding_from | winding_to | clock | tap_side | tap_pos | tap_min | tap_max | tap_nom |
|---|---|---|---|---|---|---|---|---|---|---|---|---|---|---|---|---|---|---|---|---|---|---|---|
| 123 | 5 | 95 | 1 | 1 | 64 | 61 | False | 10500.0 | 3000.0 | 30000000.0 | 0.0 | 0.203 | 100000.0 | 0.0 | 0.0 | 0 | 0 | 12 | 0 | 0 | 0 | 0 | 0 |
| 124 | 12 | 96 | 1 | 1 | 63 | 61 | False | 10500.0 | 3000.0 | 30000000.0 | 0.0 | 0.203 | 100000.0 | 0.0 | 0.0 | 0 | 0 | 12 | 0 | 0 | 0 | 0 | 0 |
Den Code einzurichten und auszuführen war einfach. Die Bedeutung der Ausgabe und die Fähigkeiten der Software zu begreifen, war es nicht. Ich komme aus der Linux-Systemadministration und Python-Programmierung, nicht aus der Elektrotechnik.
Also untersuchte ich Datenstrukturen und Funktionen, las die gut strukturierte API-Dokumentation und recherchierte die Grundlagen.
Ich hatte mir das Stromnetz immer als komplizierten, aber weitgehend statischen Schaltkreis vorgestellt. Doch besser versteht man es als dynamisches physikalisches System, dessen Verhalten unter anderem von Blindwiderstand und Blindleistung beeinflusst wird, oft auf wenig intuitive Weise. Fast wie ein lebendiger Organismus.
Gleich zu Beginn fiel mir der Wert Blindwiderstand pro Kilometer auf, der bei den Leitungen als Attribut x1 auftaucht. Blindwiderstand war für mich besonders schwierig zu verstehen. Ich sah mir YouTube-Videos an und sprach mit ChatGPT darüber. Blindleistung ist zentral dafür, zu begreifen, warum Stromnetze so schwer zu verwalten sind. Eine vollständige Erklärung sprengt diesen Beitrag.
Ich habe nicht jedes einzelne Attribut untersucht. Ich wollte zunächst ein Gefühl dafür bekommen, was das Paket leistet und wie es die reale Welt abbildet.
Als ich begriff, wie kompliziert das Stromnetz tatsächlich ist, wuchs das Ausmaß der Aufgabe in meiner Vorstellung um mehrere Größenordnungen. Ich habe in Betriebsteams bei CIBC, Merrill Lynch, Moneris Solutions und SiGe Semiconductor gearbeitet und große Dashboards voller technischer Details gesehen. Dann suchte ich nach einem Betriebsdashboard von Hydro One in Ontario.
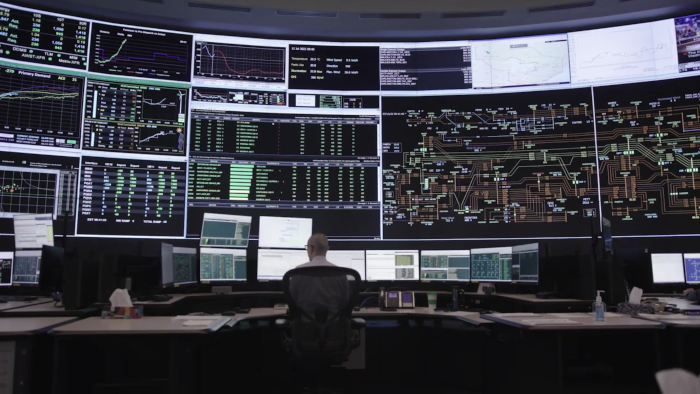
Das ist nur ein Ausschnitt, vermittelt aber einen Eindruck von der Informationsdichte und Komplexität, mit der Netzbetreiber arbeiten.
Mit pgm-ds kann man das Netz dynamisch verändern, Komponenten hinzufügen oder entfernen, Fehler und Ausfälle simulieren und Strom über redundante Verbindungen umleiten. Man kann Veränderungen modellieren, Nachfrage prognostizieren und deren Folgen untersuchen.
Bei dieser Komplexität bilden Simulationen eine natürliche Grundlage für maschinelles Lernen. Werkzeuge wie pgm-ds ermöglichen strukturierte Szenarien für Prognosen, Anomalieerkennung und Entscheidungsunterstützung.
Ein Stromnetz auszubauen und zu betreiben ist außerdem ein langsamer Prozess. Kraftwerke, Staudämme, Rechenzentren, Fabriken und Wohnviertel entstehen nicht über Nacht.
Dieses Gebiet ist technisch faszinierend und zugleich von großer praktischer Bedeutung. Solche Werkzeuge modellieren Infrastruktur nicht nur, sondern können auch dabei helfen, ihre Weiterentwicklung zu gestalten. Das macht die Arbeit intellektuell spannend und sinnvoll.
AI translation is pretty amazing these days. AI tooling is pretty great too. I host my websites on GitHub Pages and I have a ChatGPT subscription. ChatGPT co...
I noticed a couple of Ukrainian visitors to my websites! YAY!!! How exciting! :)
My little basement aquaponics setup has given me another miniature rose!!!
Some of you may have read my Git Battles post, where I talked about how I developed and a documented a Git workflow.
I recently built MyCount to track website visitors to my projects. I found that that over 40% of my visitors were from China, and that 35% of those used a Ch...
I have a future project in mind which will require a Dynamic DNS service. I created BMDynIP for that purpose. After building the service, I wanted a simple a...
I run an NFS server on my network. I use two large drives and a cron job to rsync the data to provide basic data protection. This solution will not save you ...
I’ve been tinkering with various incarnations of Patrick Loeber’s Train an AI to Play Snake tutorial for a while now. It’s my relaxing goto project that’s fu...
This project started as a cron job and a flatfile and -honestly- that would work perfectly well for a small home setup. Say, two or three machines. I’m curre...
The Bear & Moose GeoIP Project provides an easy-to-use GeoIP service for your applications and for interactive lookups.
Our first TV was a small black-and-white thing where, on rare occasions, we’d watch Animal Kingdom. Then Beta and VHS came along, and you could watch them at...
Fr3d worked: It could talk to the Snake Lab, propose changes to the RNN configuration, run experiments, look at the results, and try again. It proved the ide...
The Snake Lab had become a proper server, with a ZeroMQ API, configuration validation, a database, and a way to run experiments independently of the client. ...
In my last post, I setup a locally hosted LLM running on an old HP Z440 and wrote a crude little conversation loop. I generated random numbers, fed them to t...
This is part one of a four part blog series. In this post, I download, install and setup some software to prompt a local LLM to write haikus…
In the first post, AI FX was still mostly a seed: a repo, a PyPI package, and an idea about using automated FOREX tooling as a learning lab. Since then, the ...
A potential client pointed me to Empowering the Energy Transition Through Fast and Flexible Network Simulation. The article describes an Open Source project,...
I have a prospective client who runs a small group of technology businesses, at least one of which integrates with clients using the Delphi programming lan...
I’ve spent some time around trading systemsL At Merrill Lynch, I supported the Order Audit Trail System (OATS), a compliance system required by NASDAQ. Its p...
A Rosebud, a Few Guppies, and a Quiet Little Ecosystem
I setup an Etsy Storefront to sell high quality, museum grade prints of some of my artwork.
I’ve been working on Db4E, my Monero deployment, operations and analytics platform. It uses Linux systemd to spin up manage Monero, P2Pool and XMRig instance...
AI Snake Lab is an interactive reinforcement learning sandbox for experimenting with AI agents in a classic Snake Game environment — featuring a live Textual...
You know that saying, “A picture is worth a thousand words.”? In programming, I’d argue it can be worth a thousand lines of code…
This post is about using constants in your code. Why it matters, what the benefits are and how you can do it well. I’m sad to say, I learned this the hard wa...
This week, I introduced 15 raccoon tiger shrimp—plus a surprise 2 bonus—to my aquarium. After a proper acclimatization, I released them into the tank… and ju...
When I first started experimenting with Monero mining and self-hosted infrastructure, I did what everyone else does: I downloaded the Monero software, the P2...
Let me be honest: Git has punched me in the face more times than I can count. Every time I think I’ve got a smooth release flow down, Git yells, “Not so fast...
I was burned by opaque documentation: I’ve been building a modern terminal UI in Python using the excellent Textual framework. It’s sharp, fast, and honestly...
The original reporting system was a set of static dashboards built using GitHub Pages, JavaScript, and ApexCharts. It pulled data from my mining setup — via ...
I’ve been deep in the trenches with my Db4E project — pulling together Monero mining infrastructure, MongoDB integration, and a bunch of orchestration magic....
I recently published a small Python module to PyPI and GitHub: db4e-systemd, a lightweight wrapper around systemctl that lets you control services (start, st...
I received my order from NIKU Farms, YAY! It’s a meat delivery that my sister, Corinna Ghaznavi, gifted me this Christmas. Every two months I receive this am...
As part of my goal to be more visible in the world, I setup this domain i.e. https://osoyalce.com. I use it to publish information about the projects I’m wor...
It’s been a while since I started and then abandoned this blog. My last post was in June of 2024!!
I decided that I didn’t like the way that the main blog page looks. I am using GitHub to host the website and am using a fork of the jekyll/minima theme. My ...
It’s in the construction phase. I need to complete the water circulation process. I bought a fiber glass kit for this (and also to fix my kitchen sink!).
The XMR Mining Farm complete with this eye-popping chart The Bear and Moose Knowledge Base My resume MyZODB - A Place to Store Everything